Over the next few weeks I want to post a few articles about some of my favorite operational tricks that I’ve seen while working at Stripe.
The first, and easily my favorite, is the canonical log line. It’s a lightweight pattern for improved visibility into services and acts as a middle ground between other types of analytics in that it’s a good trade-off between ease of access and flexibility.
We could say that many production systems (following standard industry practices) emit “tiers” of operation information:
- Metrics (i.e. emitted to services like statsd, Librato, Datadog, etc.).
- Log traces.
While metrics provide fast feedback on specific and commonly-used system measurements, they’re not well suited for allowing information to be queried arbitrarily and ad-hoc. They’re perfect for answering a question that’s known ahead of time like “how many requests per second is my stack doing?”, but less useful for questions that are thought up on the spot like “how many requests per second is userXYZ making to my stack via TLS 1.0?”
Log traces can answer the latter question, but often make such analysis difficult because they tend to have poor signal-to-noise ratio when looking for specific information. They can be difficult to navigate even with sophisticated logging systems like Splunk.
Canonical log lines aim to be a middle tier of analytics to help bridge that gap:

Literally, one big log line
The concept is simple: a canonical line is a big log line (probably in logfmt) that gets emitted at the end of a request 1. It’s filled with fields for all of that request’s key information.

For example, we might include:
- HTTP verb, path
- Source IP and user agent
- Request IDs
- Response status
- Error ID and message (for a failed request)
- ID of the API key used, OAuth application and scope
- ID and email of an authenticated user
We could also include other internal information that’s not directly related to the user:
- Name of the service,
HEADGit revision, release number - Timing information (e.g. duration of the request, time spent in database)
- Remaining and total rate limits
Here’s an example in logfmt style (line breaks added for clarity):

Storing the emitted data
After emitting canonical lines, the next step is to put them somewhere useful. At Stripe we use a two prong approach combining Splunk and Redshift.
Into a real-time log aggregator (like splunk)
Splunk is a powerful shorter-term store that’s great for getting fast insight into online systems. It’s great for:
- Powerful querying syntax that’s quite terse and fast to write.
- Very fast: queries come back quickly, especially if they’re scoped down to a small slice of the total data volume (i.e. like the last hour worth of logs).
- Ingested directly from syslog so that data is available almost as soon as it’s emitted.
- By tagging every line emitted to Splunk with request IDs, we can easily cross-reference canonical lines with any other part of the raw trace that came from a request.
These traits make Splunk ideal for operational work where we might be in the midst of an incident and need information immediately.
The downside of Splunk is that it’s expensive to license and run, and your retention is generally limited by your total capacity being eaten up by the reams of raw information being pushed into the system. It’s not an unusual sight to see our operations teams at Stripe trying to prune the traces of our highest traffic systems to keep Splunk running under quota 2.
Into a data warehouse (like Redshift)
The other system that we use to ingest canonical lines is Redshift. Any other data warehousing system would do just as well.
Some advantages of a data warehouse:
- Scalability: tables can be arbitrarily large and still queryable without trouble.
- Low cost: especially compared to systems like Splunk, data can be archived for extended periods without price becoming an issue. We prune canonical lines after 90 days, but they could conceivably be stored for much longer.
- By importing other non-request data into the warehouse, like say information on your users from the core data store, it allows greater levels of deep insight by stitching together data generated from different data sources.
We import data by emitting lines over a fast queueing
system (buffered Kafka 3), archiving batches of it to S3,
and then periodically running a COPY pointing to the
bucket from Redshift.
Some real world uses
Finding HTTP 500s by failure type
One of the hazards of any software stack is that unexpected breakages will happen. For a typical web service, this often takes the form of an exception raised internally and then converted to an HTTP 500 and returned to the user.
While it’s reasonably likely that a web service already has a dashboard in place for the frequency of 500s that are occurring, what if I wanted, for example, to drill into the errors from one particular API endpoint. By scoping canonical log lines down to 500 responses coming from a single API method, that information is easily available:
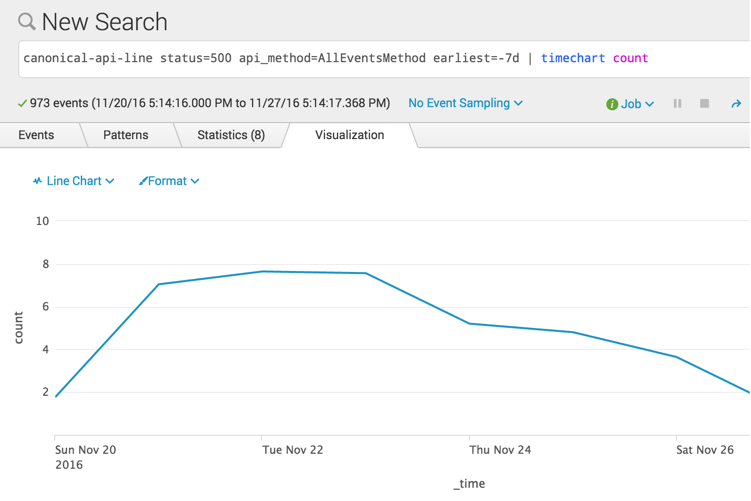
canonical-api-line status=500 api_method=AllEventsMethod earliest=-7d | timechart count
(Note: These numbers are artificial and not actually representative of Stripe API traffic.)
By putting this query into a Splunk subsearch, I can trivially join it with other emitted log lines. For example, by joining on a “breakage line” (one where we log an exception), I can look at these errors grouped by class:
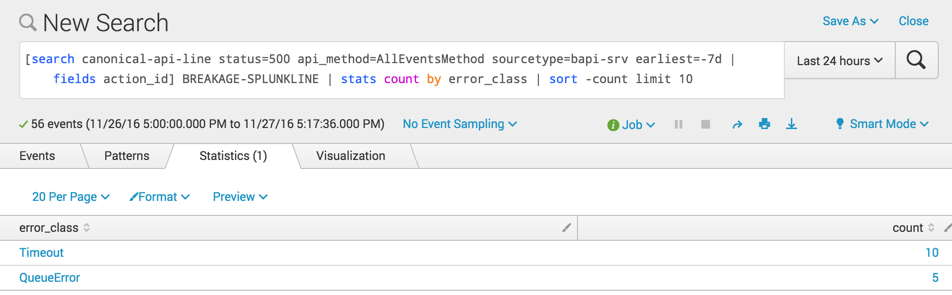
[search canonical-api-line status=500 api_method=AllEventsMethod sourcetype=bapi-srv earliest=-7d | fields action_id] BREAKAGE-SPLUNKLINE | stats count by error_class | sort -count limit 10
I can also invert this to pull information out of the canonical lines. Here are counts of timeout errors over the last week by API version:
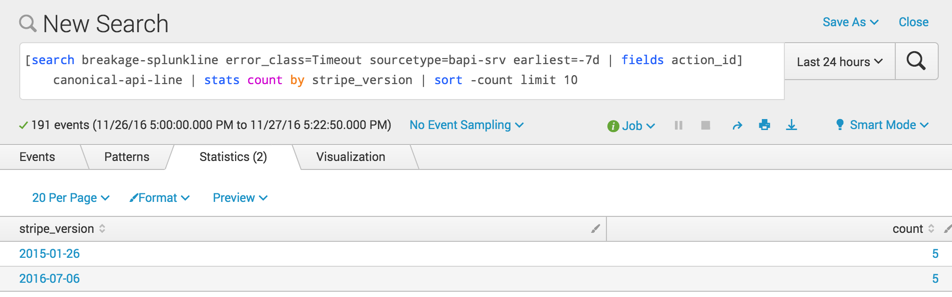
[search breakage-splunkline error_class=Timeout sourcetype=bapi-srv earliest=-7d | fields action_id] canonical-api-line | stats count by stripe_version | sort -count limit 10
Profiling requests on old TLS versions
One project that I’m working on right now is helping Stripe users migrate to TLS 1.2 from older secure protocols. TLS 1.2 will eventually be required for PCI compliance, so we’re trying to identify users who are on TLS 1.0 and 1.1 and give them some warning that an upgrade will be required.
While responding to support questions on the topic, it dawned on me that I was running the same queries in Splunk over and over. I stopped and spent a couple minutes creating a Dashboard in Splunk that’s powered purely by canonical log lines:
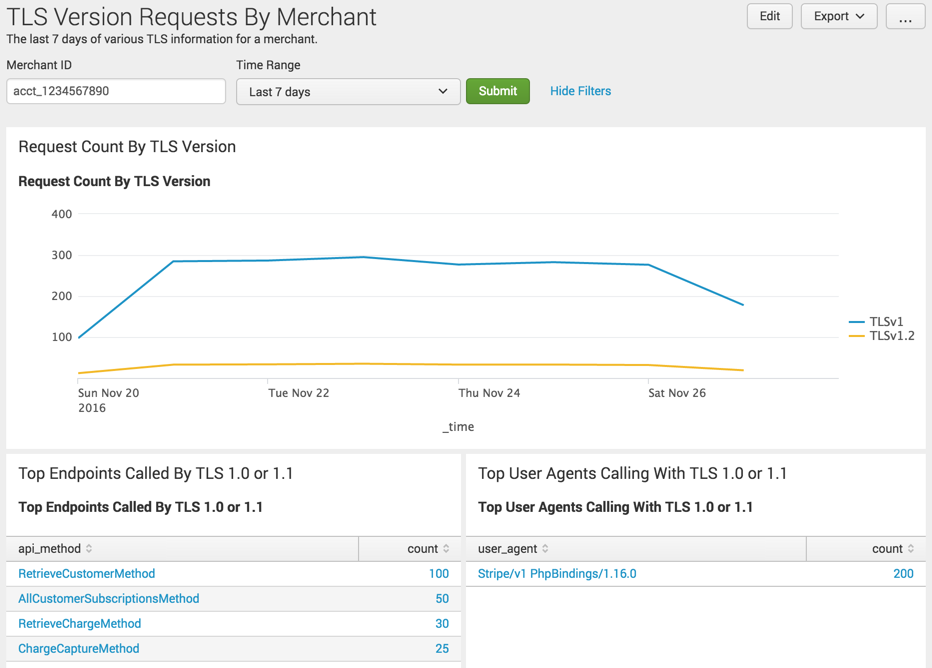
Each panel performs a search for canonical log lines matching a certain user, excludes lines generated by calls from internal systems, then pulls some metrics and tabulates or draws a plot of the results.
The same thing is also possible from Redshift. Here’s a query to ask for any users that have made requests to our API services using pre-1.2 versions of TLS in the last week 4:
SELECT distinct(user_id)
FROM canonical_lines.api
WHERE created > GETDATE() - '7 days'::interval
  AND tls_version < 'TLSv1.2'
ORDER BY 1;
An easy implementation with Rack middleware
Middleware makes a good home for implementing canonical log
lines. This middleware will generally be installed close to
the top of the stack and inject an object through context
(i.e. env in Rack) which is populated by downstream
components before being finalized and emitted by the
logging middleware.
For example, the logging middleware might inject an object
with a request_id field which will then be populated
downstream by a “request ID” middleware after it extracts
one from an incoming request’s headers.
Below is a basic implementation. Although Ruby code is provided here, the same basic concept can easily be applied to any technology stack.
# A type containing fields that we'd like to populate for
# the final canonical log line and which can encode itself
# in logfmt format.
class CanonicalLogLine
  # service information
  attr_accessor :service
  attr_accessor :release
  attr_accessor :git_head

  # request identification
  attr_accessor :request_id

  ...

  def to_logfmt
    ...
  end
end

# A middleware that injects a canonical log line object into
# a request's # context and emits it to the log trace as the
# rest of the stack has finished satisfying the request.
class CanonicalLogLineEmitter < Middleware
  attr_accessor :app

  def initialize(app)
    self.app = app
  end

  def call(env)
    line = CanonicalLogLine.new
    env["app.canonical_log_line"] = line
    ...

    app.call(env)

    # Emit to logs.
    log.info(line.to_logfmt)
  end
end
And an example of a more complete middleware stack that we install it into:
App = Rack::Builder.new do
  # Top of the middleware stack.
  use CanonicalLogLineEmitter

  # Other middleware.
  use Cache
  use Deflater
  use ErrorHandler
  use RequestID
  use SSL

  run Main
end
A happy compromise
By now I’ve hopefully convinced you that canonical log lines provide a pretty useful “middle tier” of operational visibility into a production stack. They’re not as convenient as prebaked statsd-style metrics dashboards, but are infinitely more flexible. Likewise, they don’t tell you everything that a raw log trace would, but access to information is a lot more convenient. Because they’re emitted as a simple log line, they’re easy to integrate into any tech stack you happen to be using.